Latest stats on Claude Commits

Published by Paul Kinlan on:
Following on from my post “Damn Claude, that’s a lot of commits”, I thought this follow up Tweet 6 months later would be a banger.
In my post "damn Claude, that’s a lot of commits" https://t.co/zOVMNUv6d4 I found that in March, users of Claude made about 2.6 million public, Claude attributed commits a week. I just ran the same script again, it’s now about 7m a week (in just 6 months)
— Paul Kinlan (@Paul_Kinlan) September 27, 2026
Turns out nope.
That being said, I thought I would run it again a month later and see what the current status is and document it here.
In the March post Claude Code had gone from 180K public GitHub commits a week to 2.6 million in six months, and I called the late-December 2025 curve an inflection. I re-ran the same scripts this weekend for the 52 weeks ending today, and the March number is now a quarter of the current weekly rate.
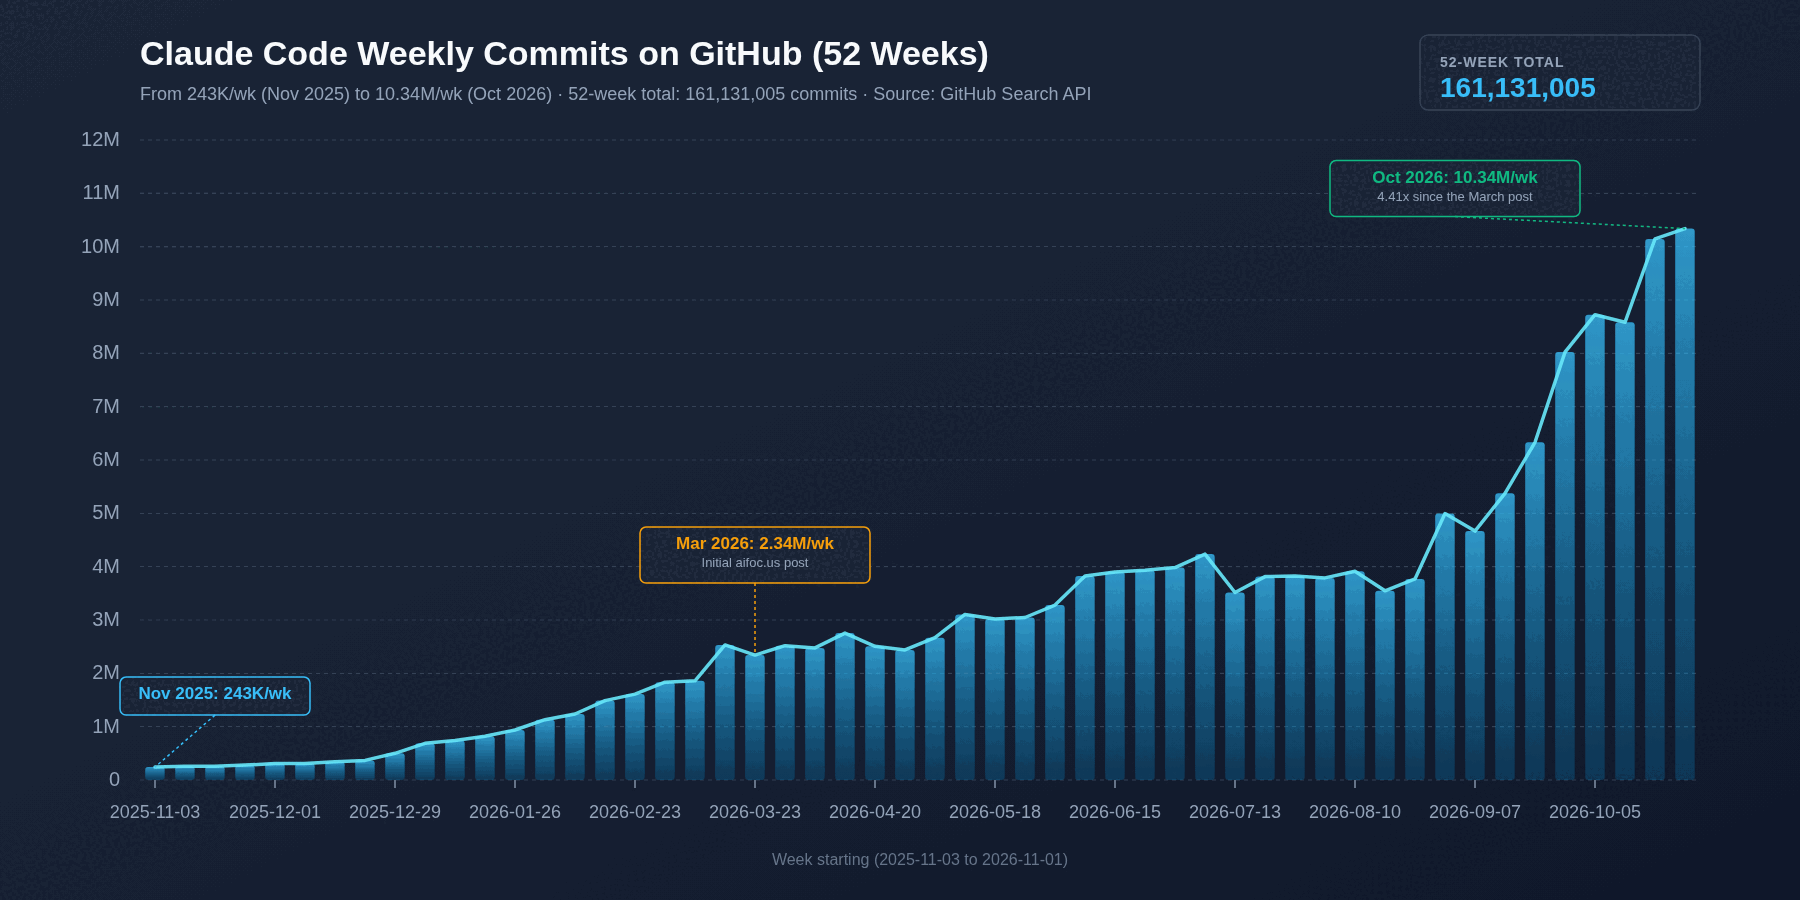
Claude Code weekly commits on public GitHub, 52 weeks to 1 November 2026
When I looked at it in March I was quite surprised by how steep the growth was, however the shape has changed since then. The first half of the year was a steady climb: 243K, 500K in the new year, 1 million by February, 2.5 million by the end of March. After this latest run you can see that it sat between 2.4 and 4.2 million a week from April through August. Then the second pop starts in the week of 31 August 2026 and does not stop: 5.0M, 4.7M, 5.4M, 6.3M, 8.0M, 8.7M, 8.6M, 10.1M, 10.3M. Something changed at the end of August and while the commit data doesn’t say it around the same time Fable 5.1 launched and then Opus 5.5 launched later in the month, but I don’t actually know what really changed. What it does show is Claude Code’s weekly output almost doubling in two months, after five months of steady growth.
What I find incredible in the moth since I run the data for my Tweet we have gone from 7M to over 10 million commits a week.
The methodology here is to use the GitHub Search API and sample the number of results that are returned (it’s not consistent so you have to sample it a couple of times).
If you are interested in how this compares to other tools? Then you can see below:
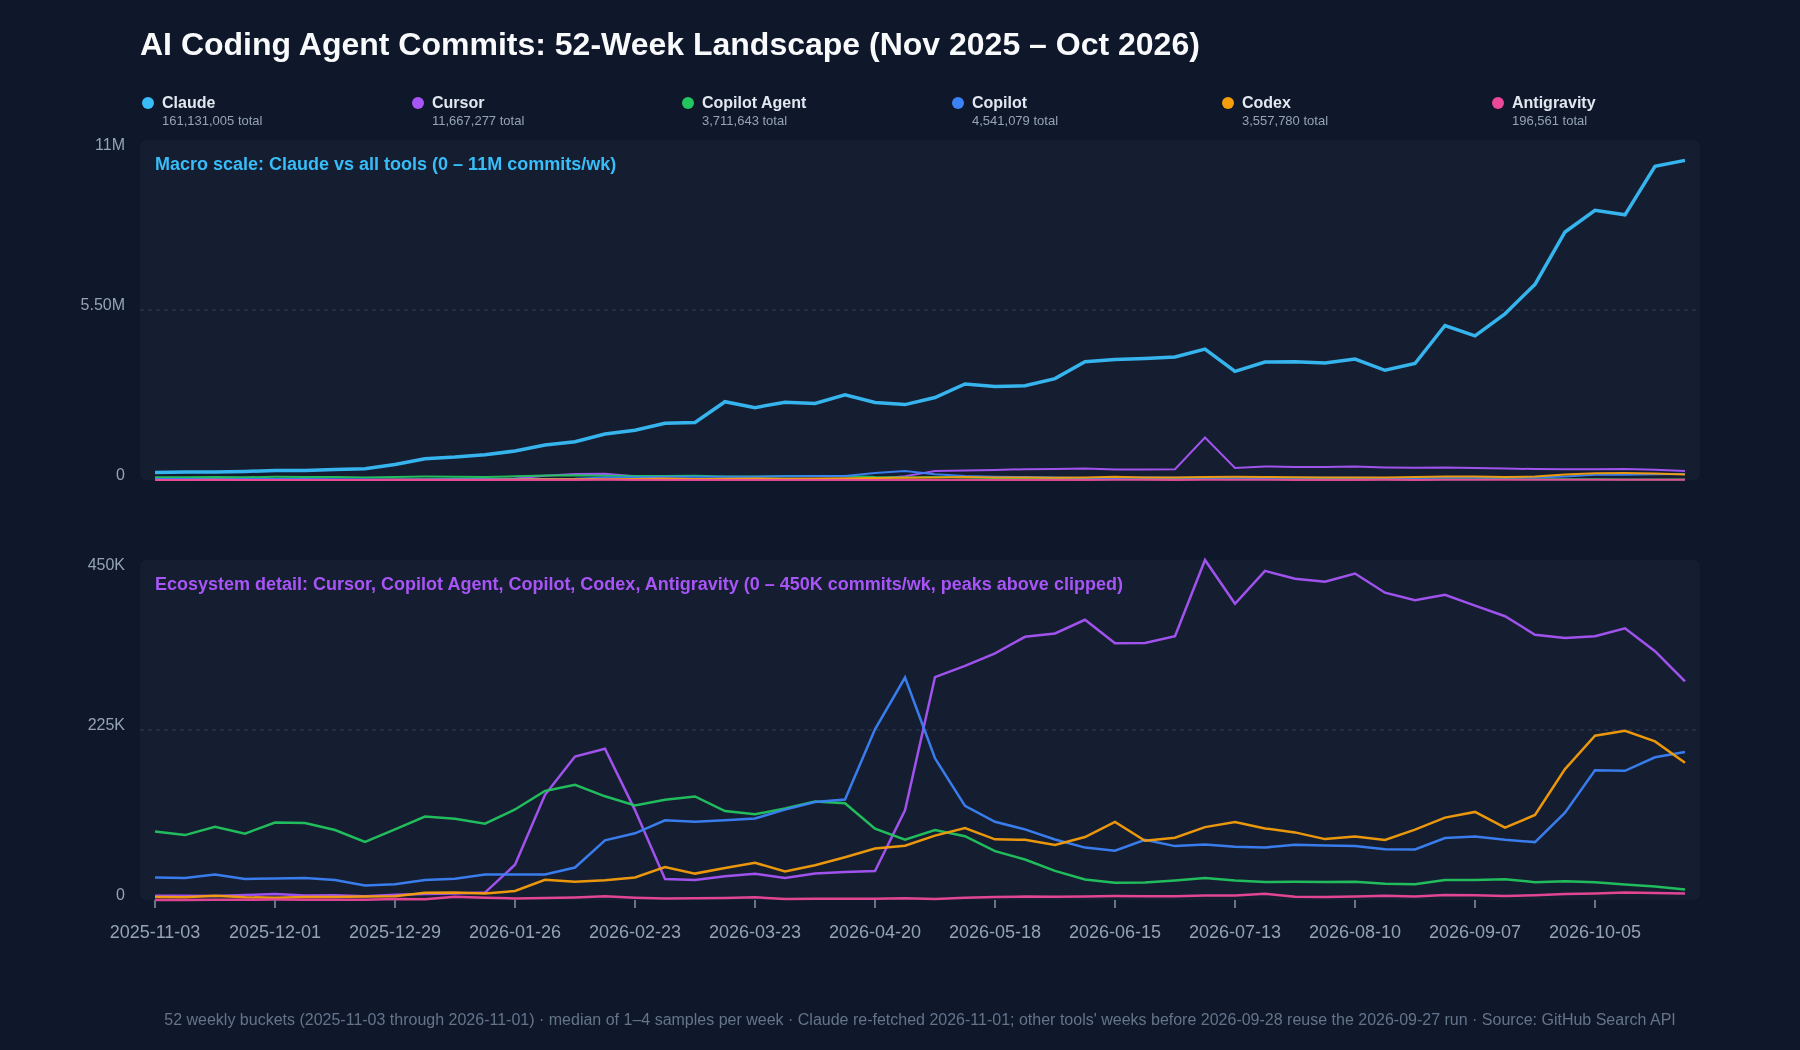
AI coding agent commits per week. Top: everything on one scale. Bottom: everyone except Claude.
While it looks like Claude is now 14x the next tool over the year, and 36x it in the latest week, you have to remember that not every other tool consistently openly attributes commits to the tool the user used, also, here are more caveats:
- Public repositories only. Everything enterprise is invisible to this.
- Detection is uneven. Claude Code writes a trailer on every commit by default, so it is over-counted relative to tools that leave no trailer, or that changed how they mark commits during the year.
- GitHub’s commit search is noisy, and noisier than it was. In September, running the same weekly query twice gave the same answer to within a commit. This weekend the same query for the week of 24 August returned 2.5M, 3.4M, 4.2M and 4.7M on four consecutive tries. I sampled every Claude week at least twice and took the median, and the other tools once, so treat individual weeks as ±20% and the trend as the thing that’s solid. The final week was pulled on a Sunday afternoon, so it is a day short (note to self: fix this - I normally write on Sundays :)
- Github Search can also not be consistent if someone makes a private repository public or private then this can impact historic stats from previous runs.
The raw data is downloadable: commits, 52 weeks to 2026-11-01. Every row includes the GitHub search URL used to generate it and the individual samples, so you can check any number yourself. The scripts are the same ones linked from the March post.
These numbers now live on a page that is re-measured at the start of every month, with every figure from this post and the March one shown next to its current value: aifoc.us/stats as well as other data that I’ve used in other posts (such as Dead Framework Theory) that I care about.
Comments